Across Europe, cities and housing providers are piloting sharing stations, tool libraries, and other access-economy infrastructure. Too often the pilot works and the scale-up never comes. Within the Digital Kiosks project we built a strategic simulation to break that pattern: a way to test, before any budget is committed, how a sharing service would perform under different ways of owning, funding, and running it. This is how it works, and why systematically simulating futures belongs in public innovation.

The pilot trap: good ideas that get stuck
Public innovation is having a moment. Cities and housing providers across Europe are experimenting with the access economy: sharing stations, tool libraries, repair hubs, neighbourhood services that let residents use things rather than own them. The environmental and social case is strong, and the pilots usually work. People show up and use them.
And then, very often, nothing more happens. The pilot runs its funded course, attention moves on, and the service never grows into anything permanent. This pattern is well documented. Studies of urban innovation find that a large share of pilot projects fade out after the pilot stage and never produce scalable solutions, and that this lack of scaling is a central problem of the field.1 Practitioners have a name for it: the pilot trap.
The reason a pilot stalls is rarely technical. A connected locker that works for two stations works for twenty. The hard part is organisational. Who owns the stations once the project funding ends? Who pays for refilling, repair, and staffing? Who carries the risk if usage is lower than hoped? A pilot can run on goodwill and a project budget. A portfolio cannot.
The Digital Kiosks project set out to help projects get past that point, both inside the project and beyond it. The methodology described here is the result.
Scaling reshuffles roles, it does not just add lockers
Within Digital Kiosks, the team at Ghent University built a strategic simulation to make the scale-up step easier to reason about. It was developed with the City of Gothenburg and its municipal housing company, Familjebostäder, using their live pilot stations as the focal case.
The starting point is a simple but consequential observation: a sharing station is not run by one organisation. It is run by an ecosystem. Treating a venture as an ecosystem of interdependent actors, each contributing value and drawing value in return, is by now an established lens in strategy research.2 In a sharing station, around sixteen distinct roles have to be filled for the service to work, from a sponsor that sets the strategic mandate, to an owner that holds the assets, to an operator, a financier, a site provider, an item custodian, and a platform provider.
Scaling does not change what the service is. It changes who holds which role. The same set of stations can be run as a fully public utility, as a fully outsourced commercial service, or through a public-private partnership in between. Each operating model is the same ecosystem with the roles distributed differently, and switching between them rewires every cost line, every revenue stream, and every value exchange at once. The simulation builds on Continuous Business Model Planning, an established approach for modelling exactly these flows of value across a business ecosystem.3, 4
Scaling does not change what the service is. It changes who holds which role.

Three ways to run the same service
The simulation makes those alternatives concrete. Three structurally distinct operating models recur across the analysis, and each carries a different distribution of ownership, funding, and risk.
| Public Utility | Public-Private Partnership | Fully Outsourced | |
|---|---|---|---|
| Who owns the stations | The city | A local partner organisation | A commercial provider |
| Who funds and runs operations | The city, from public budget | Shared. The local partner operates and can draw user fees | The provider, under contract |
| Who carries the financial risk | Sits with the city | Shared between city and partner | Sits mostly with the provider |
| Degree of public control | Highest | Moderate, steered through the partnership agreement | Lowest, exercised through procurement and contract terms |
| Best suited to | Treating kiosks as public infrastructure, where universal access outweighs cost recovery | Balancing public steering with operational capacity and partial cost recovery | Cities wanting minimal capital exposure, willing to steer at arm’s length |
Table 1. Three structurally distinct operating models for scaling a sharing service. None is the right answer in the abstract.
None of these is the right answer in the abstract. Which one fits depends entirely on what a city is trying to achieve.
Four kinds of success, measured side by side
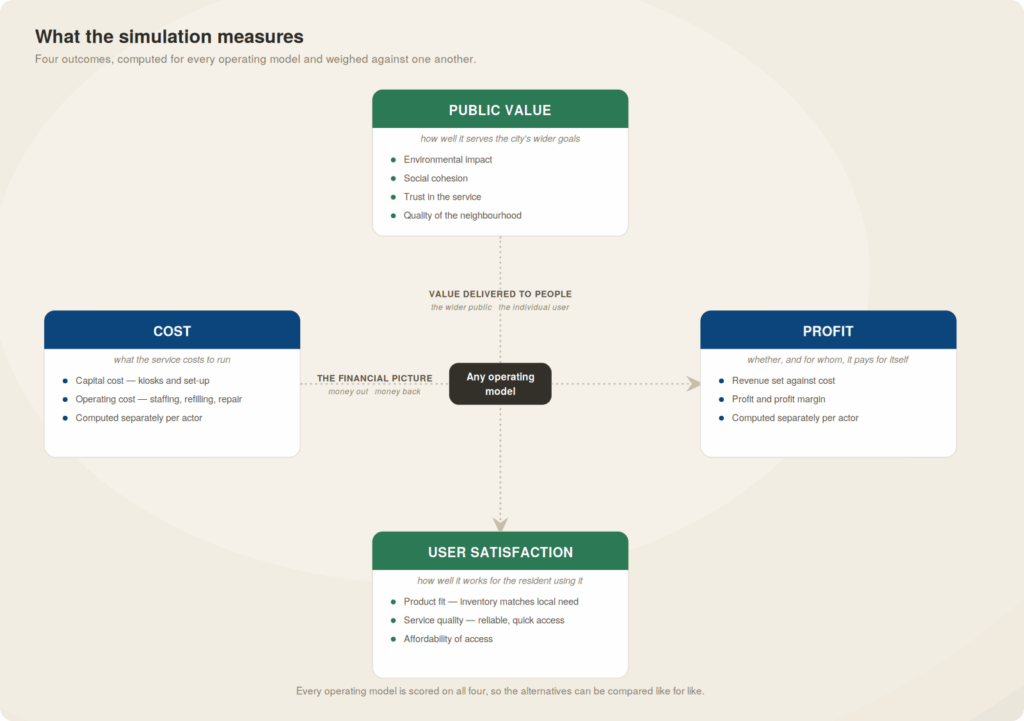
This is where the simulation does its real work. For each operating model, over a full ten-year horizon, it computes not one bottom line but four distinct kinds of outcome.
- Cost. The full cost of running the service, capital and operating, calculated separately for each actor in the ecosystem.
- Profit. Revenue set against cost, with profit and profit margin tracked per actor, showing whether and for whom the service can pay for itself.
- User satisfaction. How well the service works for the residents who use it. The model builds this from product fit, whether the inventory matches local need, and service quality, whether people can get items reliably and quickly, so it is a measured outcome rather than an afterthought.
- Public value. How well the option delivers on the city’s broader goals: environmental impact, social cohesion, trust, and quality of the neighbourhood. In the model this is captured as a single composite score; the specification calls it the Strategic Mandate Score.
Reporting all four side by side is the point. A scaling decision made on cost alone, or on public value alone, leaves most of the picture out of view.
No model wins outright; it depends on the goal
Because the simulation reports all four outcomes for every operating model, a clear and useful pattern emerges. No single operating model is best across the board. Each one tends to be more suitable for a different goal.
A model that puts the service within reach of every tenant, and scores well on inclusion and public value, is often not the model that reaches financial self-sufficiency soonest. A model that is financially light for the city may also give it the least control over how the service serves residents day to day. The strengths trade against one another.
So the central scaling decision is not “which operating model is best.” It is “which goal should lead.” A city that treats sharing stations as public infrastructure and a city that treats them as a service that should pay for itself are both reasoning correctly, and they should scale in different ways. The simulation does not resolve that choice. It makes the choice explicit and shows the consequences of each answer before any money is committed.
The decision is not which model is best. It is which goal should lead.
What each model takes to implement
The simulation shows which trade-offs a city is choosing between. Project experts supplied the other half during the calibration workshop: what each model takes to actually run.
Firmest public control and the strongest citizen trust.
- Collaboration across city departments and with social institutions
- City staffs and resources operations directly
- Continuous station maintenance
Coordinating across departments is itself a real hurdle.
Blend kiosk costs into related real-estate and urban-development budgets.
Most extensible model. Pilot technology already proven.
A capable local operator must exist. None in Gothenburg yet, and the social enterprises that could fill the role still need to grow.
- What stations should stock
- Who buys hardware and inventory
- How many stations before it is self-supporting
Enough users, the right price point, and a user base that treats items with care.
More stations, toy libraries, industry-specific tools, shared mobility. Possible partners: student organisations, libraries, foundations.
Public-procurement rules, which vary by country. Item maintenance can fold into the operator’s contract.
Lightest option technically. The city carries no technical responsibility.
- Limited local control
- Provider may sit too far from the local context
- Vendor lock-in
- Onboarding friction such as account creation can stall adoption
Continuity. Once project funding ends, no funding or income stream carries the service forward.
Public procurement and data protection.
Table 2. Practical implementation considerations recorded by project experts during the calibration workshop.
More than a spreadsheet
A spreadsheet can add up costs. What it cannot easily do is the part that matters here. It struggles to carry the ecosystem structure, the sixteen roles and dozens of value exchanges that all move at once when the operating model changes. It struggles to keep scenario, phase, and perspective consistent, so that the same formula correctly yields a different answer for each actor, in each year, along each transition path, without being rebuilt by hand. It does not naturally put public value on the same footing as money. And it tends to lose traceability as it grows, until no one is quite sure which cell drives which result.
The Digital Kiosks model is built to avoid each of those failure modes. It links several hundred formula expressions across hundreds of quarterly data points, every one resolving to a named, documented assumption. It is calibrated through a structured workshop, where roughly a hundred input variables are negotiated across the groups that hold the relevant knowledge: leadership, operations, facilities, and procurement. The output is not a single number but a defensible position, with explicit ranges where the data is uncertain.
In practical terms, the method lets a municipality or housing provider:
- Compare alternative operating models on a single, consistent surface, instead of debating them in the abstract.
- See cost, profit, user satisfaction, and public value together, rather than deciding one and hoping about the rest.
- Trace any headline number down to the specific assumption that produced it.
- Stress-test the assumptions that actually drive the decision, live, in a workshop setting.
- Re-run the model later against real operating data, to check whether the plan is holding as deployment proceeds.
The approach was evaluated by seventeen participants from across the Digital Kiosks consortium. They rated it on four dimensions adapted from the Method Evaluation Model for design methods5: ease of understanding, usefulness, quality of representation, and overall satisfaction. Scores landed consistently in the upper half of the scale, and the written feedback was clear about both the strength and the cost of the method: it makes the genuine complexity of a scaling decision visible, which is exactly the point, and exactly what makes it demanding.
Strategic planning by simulation is still uncommon in this field. Public innovation tends to move from pilot to pilot, learning case by case. Systematically working through possible futures, modelling how a service would behave under each way of organising it, is a powerful and underused tool. Putting that tool in the hands of the people who actually make the scaling decision is the contribution this work aims to make.
Open by design
Because the Digital Kiosks project is co-funded through the Interreg North Sea Programme, its analytical outputs are public. The full specification of the model, including every role definition, every operating-model alternative, the value-exchange structure, and the complete computation logic behind the four outcome measures, is available below. It is a detailed document, written for readers who want to look under the hood, adapt the framework to their own city, or challenge its assumptions. That is the intention. The contribution is not a verdict on how Gothenburg should scale its kiosks. It is a reusable way for any municipality or housing provider to ask the scaling question properly.
The Digital Kiosks project (“Innovative public-private-people partnerships to implement new infrastructure for the Sharing Economy of Goods”) is co-funded by the European Union through the Interreg North Sea Programme. The scaling analysis described here was developed by Ghent University (Faculty of Economics and Business Administration) with the City of Gothenburg and Familjebostäder.
References
1 Van Winden, W., & van den Buuse, D. (2017). Smart City Pilot Projects: Exploring the Dimensions and Conditions of Scaling Up. Journal of Urban Technology, 24(4).
2 Talmar, M., Walrave, B., Podoynitsyna, K.S., Holmström, J., & Romme, A.G.L. (2020). Mapping, analyzing and designing innovation ecosystems: The Ecosystem Pie Model. Long Range Planning, 53(4), 101850.
3 Poels, G., et al. (2018). Continuous Business Model Planning with the Value Management Platform. 12th International Workshop on Value Modeling and Business Ontologies (VMBO 2018).
4 Poels, G., et al. (2018). Designing Value Co-creation with the Value Management Platform. International Conference on Exploring Service Science (IESS 2018). Cham: Springer.
5 Moody, D.L. (2003). The Method Evaluation Model: A Theoretical Model for Validating Information Systems Design Methods. ECIS 2003 Proceedings.